Customise your
own report
Financial Review
+13%

+15%
+77%
-15%
+0.2pp
+9%
Note 1 - 2013 normalised PATAMI excludes Celcom tax incentive (-RM106.0 million), Celcom network impairment (+RM67.5 million), Robi physical count loss and impairment on receivables (+RM16.7 million), Smart asset write-off (+RM31.4 million) and foreign exchange loss (+RM201.3 million).
Note 2 - 2014 normalised PATAMI excludes gain on disposal of Samart i-Mobile (-RM116.7 million), XL gain on disposal of towers (-RM48.2 million) and foreign exchange loss (+RM55.5 million).
Note 3 - 2015 normalised PATAMI excludes XL gain on disposal of towers (-RM399.8 million), Sri Lanka tax impact (+RM49.0 million) and foreign exchange gain (-RM132.3 million).
Note 4 - 2016 normalised PATAMI excludes XL gain on disposal of towers (-RM339.6 million), XL accelerated depreciation (+RM193.3 million), Ncell purchase price allocations (+RM105.5 million), Robi accelerated depreciation (+RM110.5 million), Robi-Airtel merger one-off adjustments (+RM20.2 million) and foreign exchange loss (+RM824.1 million).
Note 5 - 2017 normalised PATAMI excludes XL gain on disposal of towers (-RM91.3 million), Ncell purchase price allocations (+RM159.2 million), loss on asset held-for-sale (+RM161.4 million), XL severance payment (+RM62.8 million), loss on disposal of joint venture (+RM40.1 million) and foreign exchange gain (-RM165.6 million).
* On normalised PATAMI, derivative gains/losses were not normalised prior to 2014. Derivatives in FY14 was RM22.5 million (loss), FY15 RM49.5 million (gain), FY16 RM77.1 million (loss) and FY17 RM73.8 million (loss).
** 2014 are based on restated financials.
** 2014 are based on restated financials.
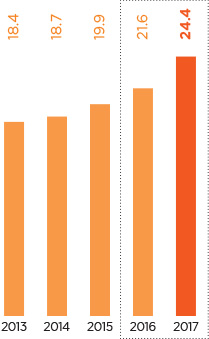
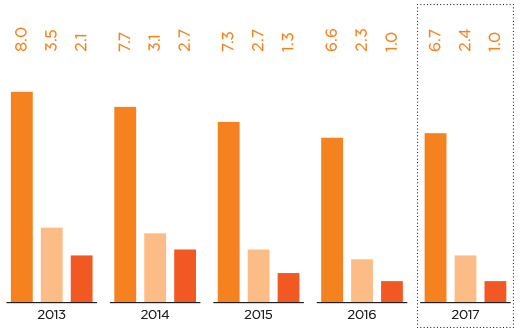
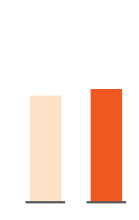
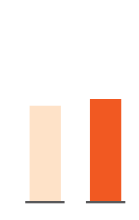
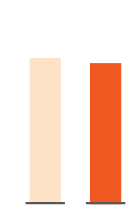
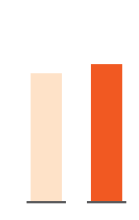
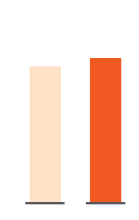
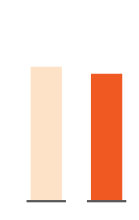
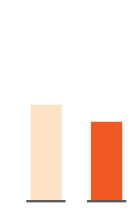
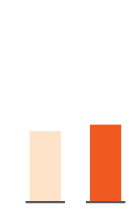
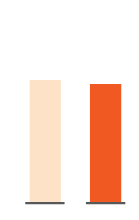
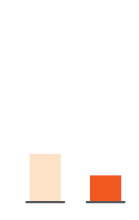
Operating Revenue
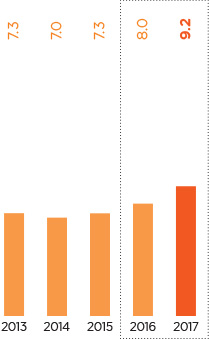
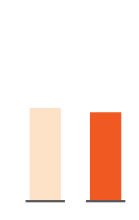
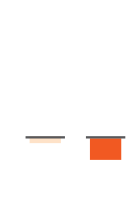
EBITDA
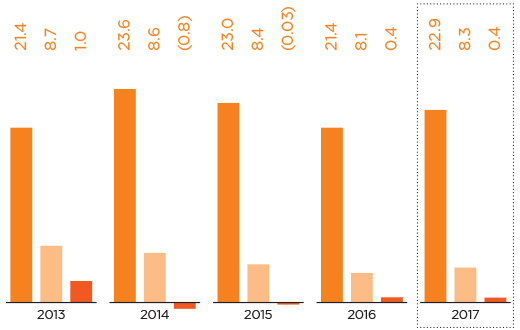
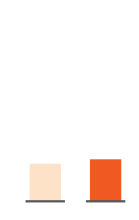
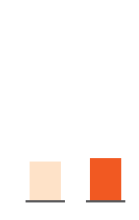
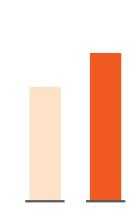
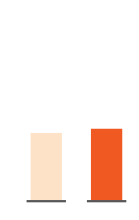
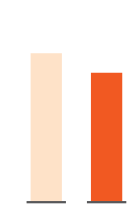
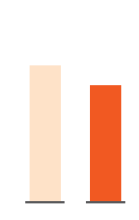
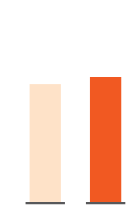
Total Assets
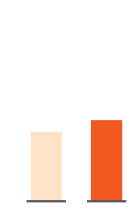
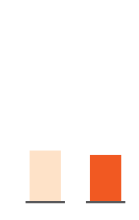
Total Liabilities & Equity
* 2016 are based on restated financials.
** Transition to no par value regime under Companies Act 2016 effective on 31 January 2017.
** Transition to no par value regime under Companies Act 2016 effective on 31 January 2017.
Operational Highlights
| All in RM Million unless stated otherwise | FY2017 | FY20162 | FY2015 | FY20142 | FY2013 |
|---|---|---|---|---|---|
| 1. Operating Revenue | 24,402 | 21,565 | 19,883 | 18,712 | 18,371 |
| 2. Earnings Before Interest Tax Depreciation and Amortisation (EBITDA) | 9,230 | 8,013 | 7,284 | 6,999 | 7,271 |
| 3. Earnings from Associates & Jointly Controlled Entities | (404) | 30 | 434 | 339 | 255 |
| 4. Profit Before Tax (PBT) | 1,936 | 1,140 | 3,331 | 3,147 | 3,533 |
| 5. Profit After Tax (PAT) | 1,162 | 657 | 2,636 | 2,369 | 2,739 |
| 6. Profits After Tax and Minority Interests (PATAMI) | 909 | 504 | 2,554 | 2,365 | 2,550 |
| 7. Normalised PATAMI1 | 1,205 | 1,418 | 2,071 | 2,256 | 2,761 |
| 8. Total Shareholders’ Equity | 24,731 | 23,581 | 23,525 | 20,761 | 19,622 |
| 9. Total Assets | 69,911 | 70,753 | 56,118 | 49,106 | 43,497 |
| 10. Total Borrowings | 19,184 | 22,260 | 16,392 | 13,893 | 13,436 |
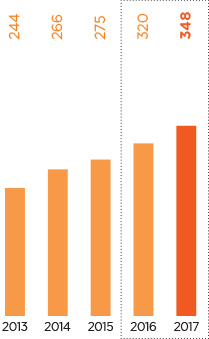
| 11. Customers (million) | 348 | 320 | 275 | 266 | 244 |
| Growth Rates YoY | |||||
| 1. Operating Revenue | 13.2% | 8.5% | 6.3% | 1.9% | 4.1% |
| 2. EBITDA | 15.2% | 10.0% | 4.1% | -3.7% | -2.1% |
| 3. Total Shareholders’ Equity | 4.9% | 0.2% | 13.3% | 5.8% | -2.4% |
| 4. Total Assets | -1.2% | 26.1% | 14.3% | 12.9% | 1.3% |
| 5. Total Borrowings | -13.8% | 35.8% | 18.0% | 3.4% | 6.1% |
| Share Information | |||||
| 1. Per Share | |||||
| Earnings (basic) – sen | 10.1 | 5.7 | 29.5 | 27.4 | 29.9 |
| Earnings (diluted) – sen | 10.1 | 5.7 | 29.3 | 27.2 | 29.7 |
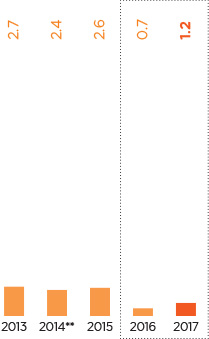
| Net Assets – RM | 2.7 | 2.6 | 2.7 | 2.4 | 2.3 |
| 2. Share Price information – RM | |||||
| High | 5.49 | 6.34 | 7.22 | 7.27 | 7.00 |
| Low | 4.29 | 4.19 | 5.71 | 6.44 | 6.16 |
| Financial Ratio | |||||
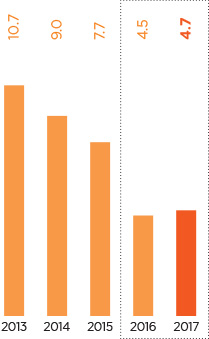
| 1. Return on Invested Capital3 | 4.7% | 4.5% | 7.7% | 9.0% | 10.7% |
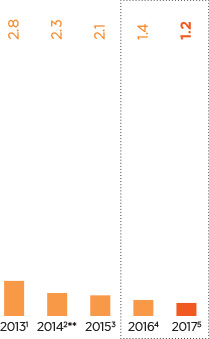
| 2. Gross Debt to EBITDA4 | 2.1 | 2.8 | 2.3 | 2.0 | 1.8 |
| 3. Debt Equity Ratio5 | 0.8 | 0.9 | 0.7 | 0.7 | 0.7 |
Note:
- Excludes foreign exchange gain/loss, gain/loss on disposal of an associate & joint venture, loss on asset held-for-sale, Ncell purchase price allocation, XL gain on disposal of towers & severance payment, Robi-Airtel merger one-off adjustments, XL & Robi accelerated depreciation, Robi physical count loss and impairment on receivables, Celcom asset impairment, tax incentive, Dialog tax impact and Smart asset write-off. From FY14 normalised PATAMI excludes gain/loss on derivatives
- FY16 and FY14 are based on restated financials
- EBIT less tax over average invested capital
- Gross debt over EBITDA
- Total borrowings over total shareholders’ equity
2017 Overview of Operating
Companies’ Performance
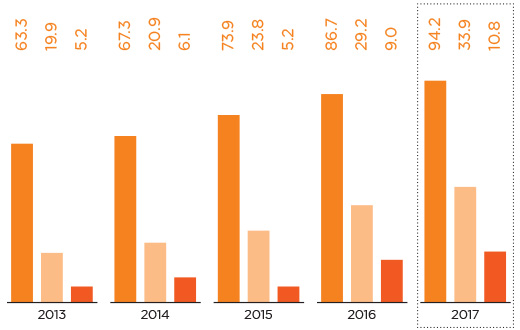
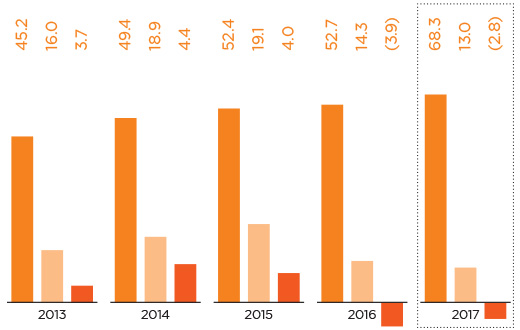
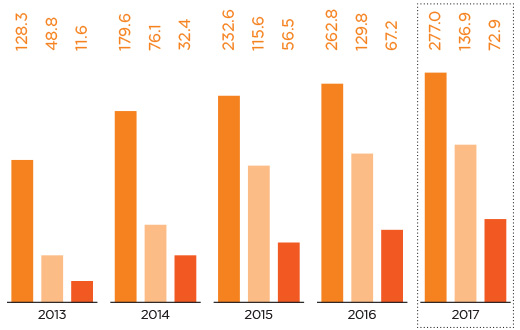
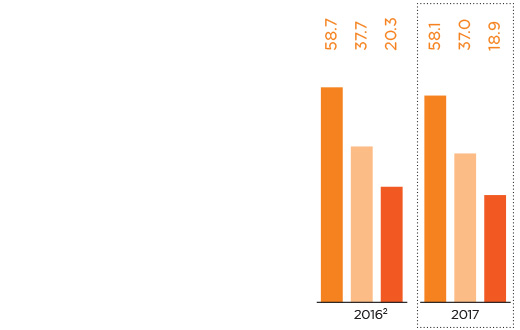
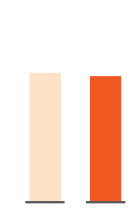
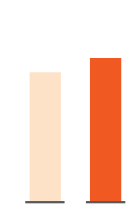
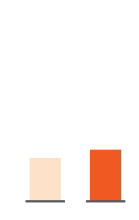
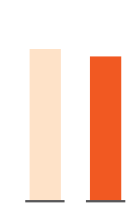
- Revenue
- EBITDA
- PAT
Malaysia
(RM Billion)
Indonesia
(IDR Trilion)
Sri Lanka
(SLR Billion)
Bangladesh
(BDT Billion)
Cambodia
(USD Million)
Nepal
(NPR Billion)
1 All financial numbers are based on audited financial figures and follows the respective country GAAP except for Ncell which has a different financial year end.
2Annualised figure based on 8.5 months since acquisition of Ncell on 11 April 2016.
In 2017, Celcom’s focused strategies on driving great customer experience led to strong data growth, with data traffic increasing more than 100%. Data revenue comprised 43% of total revenue, with smartphone penetration improving to 74%. Digital customer experiences were transformed through self-care apps, and the new Social Media Experience (smEX) hub, while Blue Cube and retail channels were revamped.
Celcom’s turnaround plan delivered strong results, and stabilised its market share in 2017. It recorded strong revenue growth of 1%, and EBITDA and PATAMI growth of 3% and 9% respectively. A strong focus on monetisation and its portfolio revamp resulted in Celcom improving Average Revenue Per User (ARPU) by RM6 for postpaid and RM2 for prepaid. Moving into 2018, Celcom will continue with its customer digitisation drive by leveraging on Advanced Analytics and Data Science capabilities supported by Artificial Intelligence.
XL returned to positive gross revenue growth in 2017, driven by strong data revenue as a result of its data-centric Transformation Agenda. Its Dual Brand Strategy resulted in the XL brand gaining traction amongst both white-collar and blue-collar workers, while Axis made inroads into the youth segment. Data was a strong driver of growth, with smartphone penetration rising to 72%. XL’s extensive 4G network covers 360 cities and areas across Indonesia.
Service revenue grew 10% to IDR20.3 trillion, driving gross revenue growth of 7% to IDR22.9 trillion, while data revenue grew 61% due to 148% increase in total traffic. Normalised EBITDA increased 7% to IDR8.7 trillion, with margins holding stable at 38%. Although 2017 PAT remained flat at IDR375 billion compared to IDR376 billion previously, on a normalised basis XL recorded net profit of IDR740 billion after adjusting for one-offs, versus a normalised net loss of IDR209 billion in 2016.
Dialog recorded stellar performance despite intense market competition. Customer share increased 1.1pp, with a customer base of over 12.8 million, while mobile broadband customer base grew 16% and smartphone adoption increased 7pp. It invested SLR9.2 billion to expand its 4G and 3G coverage. In 2017, Dialog demonstrated South Asia’s first 5G (Generation) Technology trials and introduced Voice over Long-Term Evolution (VoLTE).
Consolidated revenue grew 9% to SLR94.2 billion, and EBITDA increased 16% to SLR33.9 billion; while EBITDA margin improved 2.3pp to 36%. Net PAT grew 19% to SLR10.8 billion, driven by improved EBITDA and lower non-cash translational forex loss of SLR0.4 billion compared to loss of SLR0.8 billion in 2016. Capital expenditure for 2017 was SLR27.3 billion, directed towards investments in High-Speed Broadband infrastructure focusing on the expansion of 4G alongside the extension of Dialog’s Optical Fibre Network to support robust seamless connectivity.
Robi emerged post-merger to record strong customer growth in 2017 of 27%, strengthening its position as the second largest operator in Bangladesh. It has 29.6% customer market share, comprising 42.9 million customers. It continued focusing on effective strategies to drive growth which included innovative product offerings, an effective dual brand strategy and superior data network experience.
Robi achieved strong revenue growth of 30% to BDT68.3 billion, with data revenue growth of 89%, driven by smooth post-merger nationwide network integration and innovative data offerings. EBITDA margin stood at 19% impacted by higher network operating costs and intense price competition. It recorded Net Loss After Tax of BDT2.8 billion due to network modernisation, significant opex, high regulatory cost, sector specific taxation, and one-off adjustment relating to de-consolidation of edotco. In 2017, Robi invested BDT24 billion in the expansion of its 2G/3.5G network and 4G readiness.
In 2017, Smart invested USD80 million to expand its 4G network, and launched 4G+ with HD Voice and 4.5G. It rolled out new products and services in line with its Digital Champion agenda, along with the launch of Cambodia’s first digital venture fund, the USD5 million Smart Axiata Digital Innovation Fund (SADIF) investing in technology start-ups.
Despite the intense ongoing price war in the Cambodian telco industry, Smart recorded positive YoY growth fuelled by excellent data customer and revenue growth. Data revenue grew by 28%, with data accounting for 52% of total revenue. During the year, Smart achieved 5% YoY growth in overall revenue, while EBITDA and PAT grew 6% and 8% respectively. Moving into 2018, Smart has earmarked approximately USD80 million in capex for network expansions, aligned with its ambitions of becoming Cambodia’s Digital Champion by 2020.
Ncell solidified its leading telco position despite emerging market competition. Its customer base grew 10% to reach 16.4 million customers, driven by the launch of the ‘Internet for All’ campaign. There was strong data revenue growth of 17.8% driven by 131% growth in data volume, with data revenue contributing 19% of total revenue. Ncell’s 3G population coverage reached 53.9%, while 4G services were launched in 21 cities.
It recorded revenue of NPR58.1 billion, despite an International Long Distance (ILD) revenue decline of 19.6%. A major contributor to revenue was core revenue which increased by 8.3% compared to the previous year and strong second half revenue performance in 2017 which was 6.2% higher than the first half of 2017 and 2.4% higher compared to the same period the previous year. Lower operational expenses achieved through effective cost management initiatives resulted in EBITDA of NPR37 billion and PAT of NPR18.9 billion, despite the reduction in ILD revenue.
At Idea, heightened and intense competition within the telco industry, coupled with increased finance cost and higher depreciation and amortisation charges, led to a sharp decline in the share of results for the year by RM515.5 million from prior year profit of RM65.0 million to current year loss of RM450.5 million.
M1’s share of results for the year decreased by RM6.4 million to RM122.4 million. M1’s dividend contribution to the Group for 2017 was RM92.6 million.
Consolidated Statement of
Comprehensive Income
| Financial Year Ended | ||
|---|---|---|
| 31/12/2017 RM’000 |
31/12/2016 RM’000 |
|
| Operating Revenue | 24,402,401 | 21,565,392 |
| Operating costs | ||
| - depreciation, impairment and amortisation | (5,986,213) | (5,666,505) |
| - foreign exchange losses | (191,563) | (85,342) |
| - domestic interconnect and international outpayment | (2,700,723) | (2,096,123) |
| - marketing, advertising and promotion | (2,108,755) | (1,817,599) |
| - other operating costs | (8,455,866) | (8,074,312) |
| - staff costs | (1,906,939) | (1,564,710) |
| - other losses - net | (57,665) | (68,161) |
| Other operating income - net | 5,370 | 534,566 |
| Operating profit before finance cost | 3,000,047 | 2,727,206 |
| Finance income | 241,807 | 183,394 |
| Finance cost excluding net foreign exchange losses on financing activities |
(1,253,369) | (1,201,184) |
| Net foreign exchange gains/(losses) on financing activities | 352,000 | (599,720) |
| (901,369) | (1,800,904) | |
| Joint ventures | ||
| - share of results (net of tax) | (48,989) | (95,842) |
| Associates | ||
| - share of results (net of tax) | (352,670) | 131,124 |
| - loss on dilution of equity interests | (2,595) | (5,398) |
| Profit before taxation and zakat | 1,936,231 | 1,139,580 |
| Taxation and zakat | (773,749) | (482,422) |
| Profit for the financial year | 1,162,482 | 657,158 |
| Other comprehensive (expense)/income: | ||
| Items that will not be reclassified to profit or loss: | ||
| - actuarial gains on defined benefit plans, net of tax | 18,027 | 14,867 |
| Items that may be reclassified subsequently to profit or loss: | ||
| - currency translation differences | (2,070,454) | 1,708,339 |
| - net cash flow hedge | 271 | (2,196) |
| - net investment hedge | (15,801) | (67,555) |
| - available-for-sale reserve | (1,358) | 32,631 |
| Other comprehensive (expense)/income for the financial year, net of tax | (2,069,315) | 1,686,086 |
| Total comprehensive (expense)/income for the financial year | (906,833) | 2,343,244 |
| Profit for the financial year attributable to: | ||
| - owners of the company | 909,480 | 504,254 |
| - non-controlling interests | 253,002 | 152,904 |
| 1,162,482 | 657,158 | |
| Total comprehensive (expense)/income for the financial year attributable to: | ||
| - owners of the company | (586,819) | 1,836,063 |
| - non-controlling interests | (320,014) | 507,181 |
| (906,833) | 2,343,244 | |
| Earnings per share (sen) | ||
| - basic | 10.1 | 5.7 |
| - diluted | 10.1 | 5.7 |
Consolidated Statement of
Financial Position
| As at | ||
|---|---|---|
| 31/12/2017 RM’000 |
31/12/2016 RM’000 Restated |
|
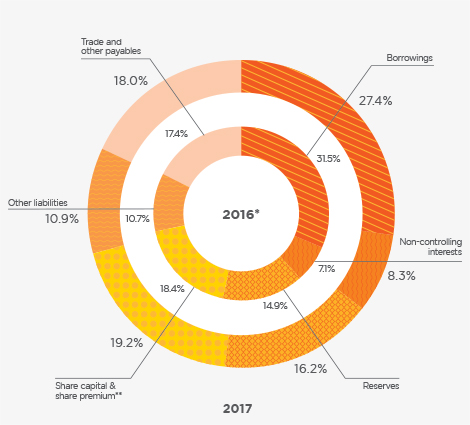
| CAPITAL AND RESERVES ATTRIBUTABLE TO OWNERS OF THE COMPANY | ||
| Share capital | 13,407,253 | 8,971,415 |
| Share premium | - | 4,081,106 |
| Reserves | 11,323,883 | 10,528,131 |
| Total equity attributable to owners of the Company | 24,731,136 | 23,580,652 |
| Non-controlling interests | 5,773,447 | 5,037,449 |
| Total equity | 30,504,583 | 28,618,101 |
| NON-CURRENT LIABILITIES | ||
| Borrowings | 14,796,319 | 15,135,472 |
| Derivative financial instruments | 1,441,161 | 1,165,857 |
| Deferred income | 270,915 | 245,894 |
| Deferred gain on sale and lease back assets | 817,073 | 1,053,855 |
| Trade and other payables | 1,644,197 | 1,581,353 |
| Provision for liabilities | 468,920 | 493,954 |
| Deferred taxation | 1,672,496 | 2,195,955 |
| Total non-current liabilities | 21,111,081 | 21,872,340 |
| 51,615,664 | 50,490,441 | |
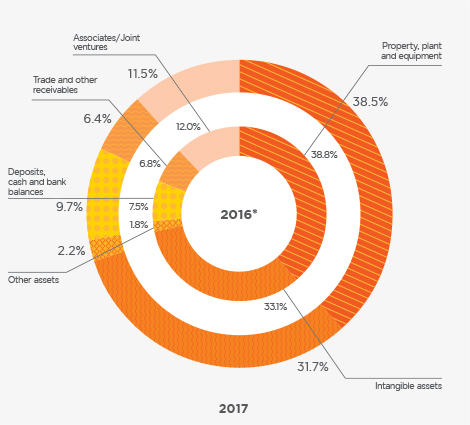
| NON-CURRENT ASSETS | ||
| Intangible assets | 22,176,286 | 23,406,105 |
| Property, plant and equipment | 26,909,970 | 27,481,605 |
| Associates | 7,985,974 | 8,400,152 |
| Joint ventures | 26,022 | 109,254 |
| Available-for-sale financial assets | 62,030 | 63,925 |
| Derivative financial instruments | 143,777 | 398,318 |
| Long term receivables | 535,157 | 117,684 |
| Deferred taxation | 270,046 | 291,633 |
| Total non-current assets | 58,109,262 | 60,268,676 |
| CURRENT ASSETS | ||
| Inventories | 174,279 | 174,747 |
| Trade and other receivables | 4,496,637 | 4,775,304 |
| Derivatives financial instruments | 53,109 | 2,735 |
| Financial assets at fair value through profit or loss | 64 | 18 |
| Tax recoverable | 41,615 | 199,111 |
| Deposits, cash and bank balances | 6,812,868 | 5,332,414 |
| 11,578,572 | 10,484,329 | |
| Assets classified as held-for-sale | 223,162 | - |
| Total current assets | 11,801,734 | 10,484,329 |
| LESS: CURRENT LIABILITIES | ||
| Trade and other payables | 12,616,963 | 12,282,899 |
| Deferred gain on sale and lease back assets | 126,017 | 140,817 |
| Borrowings | 4,387,670 | 7,124,409 |
| Derivative financial instruments | 152,621 | 162,650 |
| Current tax liabilities | 754,511 | 551,789 |
| 18,037,782 | 20,262,564 | |
| Liabilities classified as held-for-sale | 257,550 | - |
| Total current liabilities | 18,295,332 | 20,262,564 |
| Net current liabilities | (6,493,598) | (9,778,235) |
| 51,615,664 | 50,490,441 | |
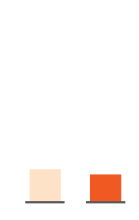
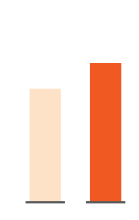
Celcom Axiata
REVENUE
+1%

EBITDA & EBITDA MARGIN (%)
+3%
PATAMI
+9%
CUSTOMERS
-10%
BLENDED ARPU

BLENDED MoU (Per Sub Per Month)
Highlights
- Turnaround and growth in all key metrics with revenue, EBITDA and PATAMI increasing +1%, +3% and +9% respectively
- Service revenue +0.5% YoY against flat industry
- Improved postpaid ARPU +RM6 and prepaid ARPU +RM2
- >RM200 million in cost savings
- #1 in Malaysian Relationship Net Promoter Score (rNPS)
- Retail transactional NPS (tNPS) score of 68, up from 58
- Best in Consumer Satisfaction from Malaysian Communications and Multimedia Commission
- 4-star rating on YouTube video checker in 20 cities in Malaysia
- YoY 4G network population coverage improvement from 76% to 87%
- Launched Fixed Mobile Convergence in East Malaysia
- Digitisation of trade, customer care, channels and workforce
Business Review
- Focused three pillar strategies to drive great customer experience
- Simple, transparent and best value products
- Consistent and seamless network and device experience
- Omnichannel customer experience.
- Transformed digital customer experiences
- Initiatives included customer self-care apps, MyCelcom Postpaid and Xpax. A new Social Media Experience (smEX) hub, among the first of its kind in Asia, enabling quick and engaging responses was introduced. Interactions with channel partners and dealers were transformed with an app to enable better dealer acquisition and retail mobile Internet provisioning experience. A more customer friendly revamped website was launched.
- Revamped retail outlets
- Complete redesign of retail experience in our Blue Cubes including features such as 3D printing and game consoles.
- Network Improvements Driving Strong Data Growth
- Competing in a data-centric market, Celcom improved its network experience considerably especially with the expansion of its 4G and 4G LTE-A population coverage to 87% and 74% in the fourth quarter of 2017. Data traffic grew more than 100%, with data revenue representing more than 43% of total revenue, up from over 34% in 2016. Smartphone penetration improved to 74% as of fourth quarter of 2017.
Financial Performance
- Successful turnaround plan
- The turnaround plan has delivered strong results, with Celcom stabilising its market share in 2017 and returning to revenue growth after three years of decline.
- Strong financial performance
- Celcom recorded improvements in its key financial metrics with strong revenue growth of 1%, and EBITDA and PATAMI growth of 3% and 9% respectively. This was off the back of higher service revenue and cost optimisation, which also resulted in gains in service revenue market share.
- Improved Average Revenue Per User (ARPU)
- Continuing with its portfolio revamp and strong focus on monetisation, Celcom further enhanced its postpaid portfolio and revamped its prepaid portfolio, which improved ARPU by RM6 for postpaid and RM2 for prepaid.
Outlook For 2018
Celcom will further digitise customer experience with a revamped e-Store and an integrated app experience, leveraging on Advanced Analytics and Data Science capabilities, supported by Artificial Intelligence. To deliver on the best video experience, network investments will focus on upgrading and optimising radio access and core networks.
Celcom will continue developing its Digital IT stack and deploy new API capabilities to shorten the time to market and simplify its IT operating environment, while increasing its usage of cloud infrastructure services and software to improve agility and cost structure. Enterprise process automation and cost optimisation remain key.
The company is looking at evolving its product portfolio into an enhanced digital lifestyle proposition, building on new innovative partnerships. Meanwhile, its Enterprise customers will be served with a broader portfolio of ICT and value added services to increase Celcom’s wallet share.
Celcom will continue to Champion the Bumiputera Empowerment Agenda while its Culture and People transformation will focus on building new digital skillsets for the future to become a truly Modern, Agile and Digital (M.A.D.) organisation .
2017 OpCo highlights are categorised according to the value creation efforts of our OpCos within our 6 Business Capitals of Financial Capital, Human Capital, Intellectual Capital, Social and Relationship Capital, Manufactured Capital and Natural Capital.
XL AXIATA
REVENUE
+7%
EBITDA & EBITDA MARGIN (%)
+3%
PAT
0% (Normalised > 100%)
CUSTOMERS
+15%

BLENDED ARPU
TOTAL TRAFFIC

Highlights
- Gross revenue +7% driven by +10% increase in service revenue
- Data revenue +61%, contributing 69% to service revenue
- Normalised Net Profit of IDR740 billion in 2017, compared to a Normalised Net Loss of IDR209 billion in 2016
- Solid profitability with normalised EBITDA +7%
- Healthy balance sheet with net debt to EBITDA of 1.5x
- Landmark 100,000th BTS installed in 2017, with XL ending the year with 101,094 total on-air BTS
- 4G LTE network in 360 cities and areas across Indonesia with >17,000 4G BTS
- Customers smartphone penetration of 72%
- “Gerakan Donasi Kuota” saw 62.64TB of data donated by customers channelled to schools
Business Review
- Successful turnaround with data-centric Transformation Agenda
- After a challenging 2016, XL returned to positive gross revenue growth, driven by strong data revenue.
- Gained traction from Dual Brand Strategy
- The XL brand gained traction amongst both white-collar and blue-collar workers, while Axis made inroads into the youth segment, with both brands offering innovative and differentiated data-led products catering to its respective markets.
- Data a strong driver of growth
- Smartphone penetration rose to 72% in 2017, with rising data consumption leading to total traffic more than doubling and accelerating consumption per subscriber.
- Sustained network investments
- XL’s extensive 4G network covers 360 cities and areas across Indonesia with more than 17,000 4G BTS, and almost 46,000 3G BTS. Increased 2016 investment outside of Jawa in 3G U900 and further BTS additions in 2017 contributed to improving traffic and revenue growth.
Financial Performance
- Strong revenue growth
- Service revenue grew 10% to IDR20.3 trillion, driving gross revenue growth of 7% to IDR22.9 trillion.
- Increased normalised EBITDA
- Normalised EBITDA increased 7% to IDR8.7 trillion with margins holding stable at 38%.
- Turnaround on net profit
- While 2017 PAT remained flat at IDR375 billion compared to IDR376 billion previously, on a normalised basis XL recorded net profit of IDR740 billion after adjusting for one-offs, versus a normalised net loss of IDR209 billion in 2016.
- Data driving strong performance
- Data revenue rose 61% YoY on the back of 148% increase in total traffic, while customers increased 15% to 53.5 million, and ARPU held steady.
- Healthy balance sheet
- Net debt to EBITDA is 1.5x, and XL continues to be free-cash flow positive.
Outlook For 2018
XL’s outlook for 2018 remains positive with data continuing to be the main driver of growth as a result of rising 4G penetration coupled with increased consumption of data and the proliferation of affordable smartphones. The Company is well positioned to capitalise on this to become the preferred mobile data provider in Indonesia.
XL will continue to focus on executing its Transformation Agenda with the launch of innovative data-led products coupled with sustained investments in network, especially outside of Jawa. In 2018, XL will continue with its contributions to the nation through CSR activities such as “Gerakan Donasi Kuota” where data donated by company and customers are channelled to schools across Indonesia, XL Future Leaders, Sisternet, Xmart Village and Nelayan Pintar (NelPin).
2017 OpCo highlights are categorised according to the value creation efforts of our OpCos within our 6 Business Capitals of Financial Capital, Human Capital, Intellectual Capital, Social and Relationship Capital, Manufactured Capital and Natural Capital.
Dialog Axiata
REVENUE
+9%
EBITDA & EBITDA MARGIN (%)
+16%
PAT
+19%

CUSTOMERS
+8%

BLENDED ARPU
BLENDED MoU (Per Sub Per Month)
Highlights
- Revenue +9% amidst challenging operating environment
- Data revenue +39%
- Strong EBITDA +16%
- Net PAT of SLR10.8 billion, the highest since 2006
- SLR27.3 billion investment in High Speed Broadband and other infrastructure
- South Asia’s first 4.5G commercial launch
- 1st trial of next-generation Massive MIMO (Multiple-Input Multiple-Output) Technology, capable of delivering speeds up to 1 Gbps
- Acquisition of 98.9% stake in Colombo Trust Finance PLC to expand into micro lending and savings
- 1st Narrowband Internet of Things (NB-IoT) in South Asia
- Sri Lanka’s 1st digital services corporate venture capital fund, the USD15 million Dialog Axiata Digital Innovation Fund (DADIF)
Business Review
- Stellar performance despite intense competition
- Customer share increased 1.1pp, with a mobile customer base of approximately 12.8 million. Mobile broadband customer base grew 16%; and smartphone adoption increased 7pp.
- Expanded network coverage
- Dialog invested in expanding 4G and 3G coverage with over 3,000 2G/3G sites and over 1,500 4G sites; trialed 5G Technology for the first time in South Asia and introduced Voice over Long-Term Evolution (VoLTE) roaming services, another first in the region.
- Enhanced digital portfolio
- eZ Cash has 3 million registered customers across four mobile networks. MyTV has a total of 1.9 million download base and ViU 0.7 million downloads. Digital advertiser Freezone.lk was launched. IdeaMart is the largest developer platform with over 8,000 developers and 14,630 active apps. Self care app recorded 1.3 million downloads which is a 1.7x growth YoY. First to launch Dialog FB ChatBot in Sri Lanka.
- Strong performance in fixed and pay-TV operations
- DBN serves over 700,000 individuals and corporates, and launched 4.5G and Prepaid LTE. Fixed LTE customer base grew 59%, while DTV customers grew 17%.
Financial Performance
- Sustained revenue growth
- Dialog’s consolidated revenue grew 9% to SLR94.2 billion.
- Strong EBITDA
- On the back of substantial revenue growth as well as disciplined cost management and operational efficiencies, EBITDA grew 16% to SLR33.9 billion; while EBITDA margin improved 2.3pp to 36%.
- Net PAT
- Net PAT grew 19% to SLR10.8 billion, driven by improved EBITDA and lower non-cash translational forex loss of SLR0.4 billion compared to loss of SLR0.8 billion in 2016.
- Focused capex to strengthen market leadership
- Group capital expenditure was SLR27.3 billion, directed towards investments in High-Speed Broadband infrastructure focusing on the expansion of 4G alongside the extension of Dialog’s Optical Fibre Network to support robust seamless connectivity.
Outlook For 2018
Sri Lanka has witnessed a rapid transformation in the telecommunication space across high-speed data connectivity, cloud storage, digital services and digitisation, with advancements in the Internet of Things (IoT) and OTT content. Within the market, there is greater demand for high-speed data, and ease of access to data. This is underlined by the increase in 3G and 4G adoption rates, and the need to roll out 5G expansion strategies with a steady increase in smartphone penetration.
With the future focus moving towards digital, the telecommunications industry continues to shift its business model from delivering organic telecommunication services, to advancing the digital age. Customer spend on entertainment is expected to increase over the next few years, with the affordability of data and device compatibility. Supplemented by this, an increase in demand for content, both local and International is expected.
2017 OpCo highlights are categorised according to the value creation efforts of our OpCos within our 6 Business Capitals of Financial Capital, Human Capital, Intellectual Capital, Social and Relationship Capital, Manufactured Capital and Natural Capital.
Robi Axiata
REVENUE
+30%
EBITDA & EBITDA MARGIN (%)
-9%
PAT 0% (normalised > 100%)
+27%
CUSTOMERS
+27%

BLENDED ARPU
BLENDED MoU (Per Sub Per Month)
Highlights
- Total revenue of BDT68.3 billion; +30% driven by the successful merger
- YoY data revenue +89% propelled by nationwide network integration post-merger
- EBITDA of BDT13.0 billion with margin of 19%, due to higher network operating costs
- Customer base +27% with addition of 9.1 million new customers, the highest in the industry
- Enriched digital portfolio with Video streaming service – iflix; mHealth platform – MyHealth; largest gaming platform in the country – MyPlay; largest digital advertising knowledge sharing platform in the country – re.con; and digital payment solution - RobiCash App
- BDT24 billion capex investment to expand nationwide 2G/3.5G network coverage
- BDT28.9 billion in contributions to Government Exchequer, comprising 42.3% of total revenue
- Expanded Management Council by 5 members to cover new strategic focus roles
Business Review
- Strong post-merger customer growth
- As the second largest operator in Bangladesh post-merger, Robi delivered strong customer growth of 27% adding 9.1 million customers to reach 42.9 million, representing 29.6% customer market share.
- Effective strategies to drive growth
- These included innovative product offerings, an effective dual brand strategy and superior data network experience.
- Digital talent management
- Introduced digital learning platform Lynda.com and employee event Digital Jam was organised.
- Focus on digital products and services
- Streaming service platform iflix was launched along with new solutions for the Enterprise business portfolio.
- Innovative customer-centric products
- MyPlan which gives customers the flexibility to customise data and voice products was launched, along with “Just Go” for the international roaming market segment, and special roaming packages for Hajj pilgrims.
Financial Performance
- Strong post-merger revenue growth
- Robi achieved strong revenue growth of 30% amounting to BDT68.3 billion, with data revenue growth of 89%, driven by smooth post-merger nationwide network integration and innovative data offerings.
- Impacts of competition
- EBITDA margin stood at 19% impacted by higher network operating costs and intense price competition. Net Loss After Tax of BDT2.8 billion was recorded due to network modernisation, significant opex, high regulatory cost, sector specific taxation, and one-off adjustment relating to de-consolidation of edotco.
- Sustained investment to improve network quality
- BDT24 billion was invested in expansion of 2G/3.5G network and 4G readiness. Total capex investment since inception is BDT206.7 billion.
- Sustained commitment since inception in 1997
- Since inception, Robi has paid more than BDT207.8 billion to the Government Exchequer, and BDT2.9 billion in dividend payouts to shareholders.
Outlook For 2018
Moving into 2018, Robi intends to continue with the implementation of its successful dual brand strategy of Robi and Airtel. It has a clearly defined strategy for 2018 till 2021 to accelerate its transformation journey from being a traditional telco to an end-to-end digital service provider. In 2018, Robi will digitalise every aspect of its business, having adopted the Modern, Agile and Digital (M.A.D.) organisational culture as an enabler.
Robi will continue to expand its portfolio of connected services such as Cloud solutions in the Enterprise business segment. It will focus efforts on the emerging IoT segment with partnerships with IoT-based factory solutions for the country’s Readymade Garment Industry.
Robi will expand the award winning online Robi 10 Minute School which has established it as the leader in digital education in the country. It will also roll out the Internet4U project in 2018 in partnership with British Council Bangladesh to promote the safe use of the Internet.
2017 OpCo highlights are categorised according to the value creation efforts of our OpCos within our 6 Business Capitals of Financial Capital, Human Capital, Intellectual Capital, Social and Relationship Capital, Manufactured Capital and Natural Capital.
SMART AXIATA
REVENUE
+5%

EBITDA & EBITDA MARGIN (%)
+6%
PAT
+8%

CUSTOMERS
-10%

BLENDED ARPU

BLENDED MoU (Per Sub Per Month)
Highlights
- Continuous strong growth of revenue, PAT, EBITDA and ROIC
- Data revenue +28%
- Data accounted for 52% of total revenue
- Growth of 5% in overall revenue
- 6% increase in EBITDA
- 8% increase in PAT
- Cambodia’s Mobile Service Provider 2017 by Frost and Sullivan
- Best Telco and the Best CSR Company in Cambodia 2017 by Global Banking and Finance Review
- IDG ASEAN Cambodia’s Best 4G LTE Provider 2017
- 1st Cambodian telco offering 4.5G
- 100% of base stations equipped with 3G
- >88% of 2,333 base stations across all 25 provinces equipped with 4G
- Launched Cambodia’s 1st digital venture fund, the USD5 million Smart Axiata Digital Innovation Fund (SADIF)
Business Review
- Expanded its 4G footprint nationwide
- Smart invested USD80 million to expand its 4G network, launched 4G+ with HD Voice and 4.5G.
- Furthered Digital Champion agenda
- Smart introduced customer self-care app SmartNas; customer reward plan SmartVIP; enhanced video streaming propositions through partnerships with local and international entertainment content providers; and released the iPhone X as the only authorised Cambodian operator distributing Apple iPhones.
- Launched initiatives to develop the Cambodian digital ecosystem
- Smart launched Cambodia’s first digital venture fund, the USD5 million SADIF investing in technology start-ups. It launched SmartStart: Young Innovation Programme, enabling university students to launch their digital ideas. Smart also secured incubator partnerships.
- Strengthened sustainability initiatives
- Smart expanded its partnership with Sipar Cambodia to improve literacy; doubled its SmartEdu scholarship recipients; launched new sport for development programmes; and remained as key development partner of the Cambodian government, while contributing to the national Capacity Building and Research and Development Fund.
Financial Performance
- Strong performance despite intense competition
- Despite the intense ongoing price war in the Cambodian telco industry, Smart recorded positive YoY growth fuelled by excellent data customer and revenue growth.
- Growth in data
- Data revenue grew by 28%, with data accounting for 52% of total revenue.
- Growth in revenue
- Smart achieved 5% YoY growth in overall revenue.
- Growth in EBITDA and PAT
- Despite the slight reduction in the number of mobile customers due to regulatory requirements of deactivating no-profile pre-paid SIM cards in the market, strong focus on cost management and capex efficiency resulted in Smart achieving 6% and 8% YoY increase in EBITDA and PAT respectively
Outlook For 2018
As Cambodia’s leading mobile telecommunications operator, Smart remains committed to its customers and the people of Cambodia, in delivering on its promise of enriching their lives through world-class networks and exceptional digital experiences. Moving into 2018, the Company has earmarked approximately USD80 million in capex for network expansions. As Smart strives to become Cambodia’s Digital Champion by 2020, the Company expects to strengthen its data leadership while introducing new digital, entertainment and lifestyle offerings to the market.
While several challenges related to the regulatory environment as well as an even further intensified competition remain as concerns for the Cambodian telecommunications market, Smart remains cautiously optimistic about the Company’s financial performance for 2018. As the year unfolds, Smart will press ahead while it continues playing a key role in developing the ICT sector and building a digital Cambodia.
2017 OpCo highlights are categorised according to the value creation efforts of our OpCos within our 6 Business Capitals of Financial Capital, Human Capital, Intellectual Capital, Social and Relationship Capital, Manufactured Capital and Natural Capital.
Smart financials shown as 12 month edotco consolidated.
Ncell Axiata
REVENUE
-1%
EBITDA & EBITDA MARGIN (%)
-2%
PAT
-7%

CUSTOMERS
+10%

BLENDED ARPU
BLENDED MoU (Per Sub Per Month)
Highlights
- +8.3% YoY in core revenue* representing 73% of total revenue in 2017 compared to 67% in 2016
- Maintained a strong EBITDA margin of 63.8%
- Delivered 32.7% PAT margin
- Delivered ROIC of 57%
- Widest nationwide 4G network coverage, 4G launch in 21 cities
- 4G population coverage at 15.5%
- Restructured Sales and Distribution from 3-tier to 2-tier model for better trade control and higher retail channel visibility
- Relative Net Promoter Score (NPS) of 7.4%
- Customers +10% to 16.4 million
- Data customers +19% to 7.1 million
Business Review
- Solidified its leading telco position in Nepal
- Ncell’s performance and profitability remained strong in 2017.
Customer base grew by 10% to reach 16.4 million customers, driven by the launch of the ‘Internet for All’ campaign, despite emerging market competition.
- Strong data revenue growth
- Data revenue contributed 19% of total revenue, with data revenue growth of 17.8% driven by 131% growth in data volume.
- Expanded network coverage nationwide
- 3G population coverage reached 53.9%. 4G services were launched in 21 cities resulting in 4G population coverage of 15.5%.
- Enhanced digital services portfolio
- New products included Magic Voice, iflix, and Matchstix applications.
- Improvements in network
- Capex of NPR12 billion was invested to improve network coverage and quality of service.
- Retail channel improvements
- As a result of the successful demarcation of its sales and distribution channel, Ncell gained better control and visibility of its retail channel.
Financial Performance
- Recorded strong revenue
- In 2017, Ncell recorded revenue of NPR58.1 billion, despite an International Long Distance (ILD) revenue decline of 19.6%. A major contributor to revenue was core revenue which increased by 8.3% compared to the previous year and strong second half revenue performance in 2017 higher by 6.2% than the first half of 2017 and 2.4% more compared to the same period the previous year.
- Strong EBITDA and PAT
- Lower operational expenses achieved through effective cost management initiatives resulted in EBITDA of NPR37 billion and PAT of NPR18.9 billion, despite the reduction in ILD revenue.
PAT was impacted by foreign exchange losses in 2017 to the amount of NPR1.7 billion compared to NPR0.5 billion foreign exchange gain in 2016. Normalise PAT 2017 will be NPR20.6 billion while normalise PAT 2016 would be NPR19.8 billion.
Outlook For 2018
Ncell remains committed to maintain its leadership position with customer intimacy as its core value, coupled with superior network experience. Moving into 2018, Ncell will focus on three key strategies of Growth Initiatives; Transformation; and Expanding into New Core Business including Enterprise Solutions, Digital Services and Convergence.
Growth initiatives will focus on the core telco business to drive data revenue, with digital transformation, network resiliency and cost management contributing to sustainable revenue growth. A focused market segmentation approach will be utilised to better understand consumer needs.
Ncell will continue to focus on extending its data leadership, whilst maintaining voice and ILD revenue contribution. Cost efficiencies remain a priority to ensure sustainability while ensuring highest standards of customer services.
Ncell is embarking on a digital transformation journey, aimed at better serving its customers and expanding its digital services ecosystem. It remains committed to nation building efforts, especially within technopreneurship development, disaster early warning system and improving rural broadband connectivity.
* Core revenue includes revenue from Data, Voice, VAS, digital services and others, but excludes International Incoming Voice revenue.
2017 OpCo highlights are categorised according to the value creation efforts of our OpCos within our 6 Business Capitals of Financial Capital, Human Capital, Intellectual Capital, Social and Relationship Capital, Manufactured Capital and Natural Capital.
IDEA
REVENUE*
-19%

EBITDA & EBITDA MARGIN* (%)
-43%
PAT*
->100%
CUSTOMERS*
+1.7%
#VLR customers
Highlights
- Upcoming merger with Vodafone India to become largest Indian telco with more than 400 million customers
- Transformation into Digital Idea with integrated Digital Entertainment Apps
- Pan-India wireless broadband network with 4G roll out
- 50,000 broadband sites rolled out
Business Review
- Focused future post-merger plans
- Following on from the merger announcement between Idea and Vodafone India, both companies have agreed to sell their respective tower businesses to ATC Telecom Infrastructure Private Limited for an aggregate enterprise value of INR78.5 billion, with Idea receiving INR40.0 billion should the towerco sale precede merger completion.
- Successfully mitigated regulatory challenges
- Upon the Indian Government’s mandated reverification of mobile users, Idea enabled Aadhaar (Unique ID) based reverification for its customers, successfully navigating challenges such as coordination with multiple government agencies, setting up new IT systems, and training employees to assist customers.
- Transforming into Digital Idea
- Idea embarked on its transformation from a pureplay mobile services provider to an integrated digital services and solutions provider by launching new digital entertainment apps, while introducing new content and real-time access to network and coverage on the MyIdea app.
- Expansion of network infrastructure
- Idea rolled out its 4G network, while broadband sites have been expanded by a factor of approximately 3x within the last two years, to 143,565. Idea’s 3G and 4G population coverage exceeds 634 million people, or 52.4% of the population across 22 service areas, covering over 154,000 towns and villages.
Financial Performance
- Growth in voice traffic
- Voice traffic increased approximately 35% YoY during the quarter ending 31 December 2017, as a result of increased adoption of voice telephone and broadband data.
- Intense price competition affecting performance
- The Indian telco sector witnessed an intense price war triggered by free/below cost services by the new entrant causing a significant drop in mobile data tariffs across the industry to amongst the world’s lowest levels which resulted in severe financial stress for telco operators. Consistent with overall industry performance, Idea recorded a decline in revenue, profitability and cash flows, with overall revenue declining to INR 65.1 billion in the quarter ending 31 December 2017, representing a 12.8% reduction Quarter on Quarter (QoQ). EBITDA reduced 18.5% QoQ in the same quarter, and Idea recorded a loss of INR12.8 billion.
- Regulatory shifts affecting performance
- In the quarter ending 31 December 2017, the Indian telecom regulator reduced the ‘Mobile Termination Charge’ which further affected the industry causing a 57% decline in Interconnection Usage Charge (IUC) settlement rates. This impacted Idea’s revenue and EBITDA by INR8.2 billion and INR2.3 billion respectively, in that one quarter alone.
Outlook For 2018
In line with the Indian Government’s ‘Digital India’ vision to deliver significant benefits to 1.3 billion people and creating substantial value for all stakeholders, Idea Cellular and Vodafone Group Plc announced their agreement to merge in 2017. The merger, expected to be completed in the first half of 2018, would result in an entity which will be the largest communications provider in India and one of the largest globally.
Despite the intense competition and regulatory pressures, Idea has remained committed to grow its mobile voice and broadband market through capex infusion, network expansion and product and service enhancement to enable a digital society.
* All financials are for nine months ending December 31 for both years.
2017 OpCo highlights are categorised according to the value creation efforts of our OpCos within our 6 Business Capitals of Financial Capital, Human Capital, Intellectual Capital, Social and Relationship Capital, Manufactured Capital and Natural Capital.
M1
REVENUE
+1%

EBITDA & EBITDA MARGIN (%)
-3%
PAT
-11%
CUSTOMERS
+2%

Highlights
- Operating revenue +1% to SGD1,071.1 million
- Service revenue +2.8% to SGD828.1 million
- Fixed services revenue +24.5% SGD129.7 million
- Mobile data revenue +1.7 percentage points YoY to 55.7% of service revenue
- Healthy net debt to EBITDA at 1.3x
- Southeast Asia’s 1st and the world’s 2nd commercial nationwide Narrowband Internet of Things (NB-IoT) network
- World’s 1st symmetrical 10Gbps Passive Optical Network (PON) corporate connectivity service
- Launched mobile remittance service M1 Remit
- Launched MySIM3 98, Singapore’s 1st unlimited local data 4G mobile plan
Business Review
- Postpaid mobile segment key contributor to revenue
- Postpaid segment made up 63.4% of total mobile customer base and contributed 90.6% of mobile revenue. Customers increased by 45,000 to 1.3 million.
- Growth in mobile data
- Average data usage per smartphone customer increased to 4.3GB per month in the fourth quarter of 2017, from 3.6GB per month in 2016 driven by faster networks and devices.
- Expanded product portfolio
- Introduced two new regional Data Passports. Data roaming customers and traffic grew by more than 50% and 150% respectively, in 2017.
- Growth in corporate fixed services
- Augmented by the launch of the world’s first symmetrical 10Gbps PON connectivity service, and next-generation unified operations monitoring centre, the segment contributed 50% of fixed services revenue.
- Invested in network enhancements
- Initiatives included successful 5G trial demonstration of Singapore’s highest transmission speeds of 35Gbps; expanding HetNet; and successful drone trials for 4.5G HetNet.
Financial Performance
- Increased revenue across the board
- Operating revenue increased 1% to SGD1,071.1 million, while service revenue grew by 2.8% to close the year at SGD828.1 million. Fixed services revenue increased 24.5% to SGD129.7 million, accounting for 15.7% of service revenue compared to 12.9% previously. Mobile data revenue increased 1.7 pp to 55.7% of service revenue.
- Reduction in net PAT
- Net PAT decreased by 11% to SGD132.5 million, mainly due to higher handset loss, as well as higher depreciation and amortisation, and interest expenses. Net PAT margin on service revenue closed 2.6 pp lower at 16.0%.
- Higher capex leading to reductions in free cash flow
- Free cash flow decreased 17.9% to SGD106.7 million due to working capital changes and higher capital expenditure. Net debt to EBITDA remained healthy at 1.3x.
Outlook For 2018
M1 remains committed to continuous improvements of its services, by deepening segmented offerings and delivering superior customer experience to attract and retain customers. It is well placed to capture new opportunities in the Internet of Things (IoT) and Smart Nation space, as a leading IoT solutions provider which continues to partner world-class solution providers to expand its IoT products and services portfolio.
Within its Corporate and ICT business, M1 is building and acquiring competencies, and forming key partnerships with technology and solution providers, to strengthen and expand corporate solutions in areas of managed infrastructure and security solutions, Smart Nation initiatives, and cloud and data analytics.
From strengthening its core connectivity infrastructure, building digital and ICT capabilities, to digitalising its operations, M1 is on track to transform into a Smart Communications Provider, and build new revenue streams that will deliver growth and long-term value for its stakeholders.
2017 OpCo highlights are categorised according to the value creation efforts of our OpCos within our 6 Business Capitals of Financial Capital, Human Capital, Intellectual Capital, Social and Relationship Capital, Manufactured Capital and Natural Capital.
Digital Businesses - Axiata Digital & Xpand
Highlights
- Refined Digital Strategy pivoting into 4 lines of Digital Businesses
- Boost has ~2.2 million users and >11,000 payment touchpoints
- apigate has 1.3 billion users, connecting >50 MNOs
- Xpand acquired 65% stake in Suvitech, furthering its MVNx strategy
- Increased reach of Digital Advertising services through ada
- Xpand acquired >1Gbps HTS from IPSTAR to provide reliable broadband services
- BIMA – won awards from Wall Street Journal, IDC Digital Transformation Award and Fintech Finals 2017
Business Review
- Axiata’s refined digital strategy
- Axiata’s refined digital strategy is now spread across two distinct digital operating companies, Axiata Digital Services or Axiata Digital and Axiata Business Services, operating under the brand Xpand. Together, these digital businesses are involved in key verticals of Digital Financial Services (DFS), Digital Advertising, Enterprise Solutions/Internet of Things (IoT), and Digital Platforms.
- Axiata Digital’s focused investments
- Axiata Digital’s portfolio of investments is pivoting into three lines of operational businesses of DFS, Digital Advertising and a Digital Platform Business to capitalise on the multi-billion dollar digital market opportunities and creating new revenue stream as part of our New Generation Digital Champion ambitions. Axiata Digital’s target is to create valuations of USD1 billion for each of these lines of digital businesses.
- Expanded DFS offerings
- Within financial services, Axiata Digital is building one of the largest DFS companies in Asia to provide 5 microservices of payments, remittance, lending, saving and insurance. E-wallet service Boost was launched in Malaysia in January and has approximately 2.2 million users in three months, and over 11,000 payment touchpoints. It has partnerships with major universities, highways concessionaires and large F&B chains. Axiata Digital now has digital wallet services in five markets.
- Increased reach of AdTech services through ada
- Axiata Digital launched ada, an integrated digital marketing business focused on data driven advertising model to unlock brand potential in digital. The new business is targeting the multi-billion segment of digital advertising and will provide seamless offerings in data science, technology and creative, all connected to form and deliver a powerful digital ecosystem for our brands and advertisers.
- Capturing growth opportunities in Enterprise Solutions/ IoT through Xpand
- Xpand is focused on the multi-billion addressable B2B and B2B2C solutions across multiple industries and aims to achieve double digit growth. In 2017, it acquired 65% stake in Suvitech Co Ltd, a Thailand-based owner and operator of a mobile virtual network enabler (MVNE) platform, to further its strategy as a mobile virtual network operator/enabler (MVNx). Xpand also acquired over 1Gbps High Throughput Satellite (HTS) capacity for a four-year period from IPSTAR International Pte Limited, to catalyse its growth while providing reliable broadband services to all potential customers regardless of location.
- Expanded the footprint of its Platform Business
- apigate is Axiata Digital’s GSMA award-winning platform service, comprising a highly-secure, plug-and-play enablement platform that connects developers and businesses to global consumers. apigate serves 1.3 billion users and connects more than 50 Mobile Network Operators (MNO) across Asia, Africa, Europe and South America.
Outlook For 2018
Moving forward into 2018, Axiata Digital aims to be a key contributor to the Group and a leader in each of its business verticals, while monetising the Company’s existing assets to further increase its share of value. Axiata Digital also intends to remain on course with its social commitments, through its digital investments and funds to enable and strengthen the digital ecosystem.
Within the digital financial services segment, Axiata Digital will be focused on payments, remittance, lending, savings and insurance. Meanwhile, it will continue to leverage on telco and external data paired with its existing financial services data to further enhance its Universal Data Hub platform with advanced analytics capability to assist in driving the outcome-based advertisement business and new financial products.
2017 OpCo highlights are categorised according to the value creation efforts of our OpCos within our 6 Business Capitals of Financial Capital, Human Capital, Intellectual Capital, Social and Relationship Capital, Manufactured Capital and Natural Capital.
edotco
REVENUE
+11.8%

TENANCIES & TENANCY GROWTH
+18.9%
+0.13x
+0.13x
Highlights
- Upsizing edotco’s 2016 largest global tower sector private placement by USD100 million
- Contributed 5.9% and 6.8% to Group revenue and EBITDA respectively
- Revenue +>100% from higher tenancies and maiden contributions from Tanzanite and consolidation of edotco Bangladesh
- Increase in tenancy ratio of 1.57x in fourth quarter of 2017 compared to 1.44x in fourth quarter of 2016
- Completed acquisition of stake in edotco Cambodia of 62.5%
- Acquired Tanzanite with a portfolio of 700 towers
- Increased edotco Bangladesh shareholding from 49% to 80%
- Acquired Deodar to make edotco the 8th largest independent towerco globally upon completion
- 9.9% YoY growth in towers owned; 7.3% YoY growth on sites managed
- Conferred the Asia Pacific Telecoms Tower Company of the Year 2017 Award by Frost & Sullivan
Business Review
- Upsized 2016’s largest global tower sector record equity private placement deal to USD700 million
- edotco’s lucrative investment proposition attracted high quality investors in its first round of private placement in 2016 which set the record as the largest global tower sector private placement deal of the year. In its second round of private equity placement in April 2017, Kumpulan Wang Persaraan (Diperbadankan) (KWAP) joined the fold of edotco investors through a USD100 million upsizing, bringing the total private equity placement to USD700 million.
- Significant contributions Group performance
- edotco significantly contributed to the Group with impressive growth in revenue from 3.0% in 2016 to 5.9% in 2017, and an increase in towers and tenancies of 9% and 19% respectively. edotco also ended the year with an all-time high co-location ratio of 1.57x.
- Acquired Tanzanite to expand tower portfolio
- Through a USD90 million valued acquisition of Tanzanite Tower Private Limited in Pakistan, edotco added 700 towers to its portfolio, providing tenancies to all major mobile operators in the country. It is now Pakistan’s largest independent tower company
- Acquisition of Deodar in 2018 to become 8th largest global towerco upon completion
- In 2017, edotco announced the acquisition of Deodar Private Limited. Targeted to be completed in the second quarter of 2018, this will add 13,000 towers to edotco’s portfolio, taking the company’s global tower ranking from 12th to 8th place, and the second largest multi-country tower operator globally.
- Solidified regional holdings
- During the year, edotco increased its edotco Bangladesh shareholding from 49% to 80%; and completed the acquisition of its stake in edotco Cambodia of 62.5%, further solidifying its regional presence.
- Innovations on energy efficient telecoms solutions
- edotco’s tower innovations in 2017 included the deployment of the first ever innovative Bamboo Telecom Tower in the South Asia region in Bangladesh, and the first ever nine multi-beam antenna in the ASEAN region for the SEA Games in Malaysia.
- Received regional and international recognition of exemplary business performance
- edotco Group was awarded the Frost and Sullivan 2017 Asia Pacific Telecoms Tower Company of the Year Award for exemplary business growth and performance in Southeast Asia.
Outlook For 2018
In 2018, edotco aims to focus on deepening its customer relationships in its markets. New markets in the Asian region will continue to be of interest. edotco also aims to step up its operations excellence by embracing a greater use of real-time digital platforms, data analytics and introducing drones into service.
As it expands the business organically and inorganically to further strengthen its position as a leading integrated telecommunications infrastructure services provider, edotco remains focused on taking an innovative approach to energy design, sustainable material usage and energy management solutions, in line with its commitment to proactively reducing carbon footprints and positively impacting the environment.
edotco will continue to champion social responsibility through its Tower to Community projects aimed at the development of communities it is present in, and engagements with relevant stakeholders in nation building initiatives. It takes a holistic business approach as a leader in its field with a clear vision for the next wave of telecommunications, driving innovation to continuously connect people and industries. edotco is determined to become a world-class business and one of the world’s largest independent tower companies by 2020.
2017 OpCo highlights are categorised according to the value creation efforts of our OpCos within our 6 Business Capitals of Financial Capital, Human Capital, Intellectual Capital, Social and Relationship Capital, Manufactured Capital and Natural Capital.
Sustainability Highlights
Axiata’s 4P Sustainability Framework is aligned with our broader vision of Advancing Asia, to create long-term value for all our stakeholders through innovation, connectivity and talent. As we continue with our journey towards becoming a New Generation Digital Champion by 2021, we remain committed to advancing Economic, Environmental and Social (EES) sustainability imperatives within all our countries of operation.
Initiatives within our 4P Sustainability Framework supports the targets of the United Nations Sustainable Development Goals (UNSDG), and through our membership of the GSMA’s Mobile for Development platform, and commitment to the Humanitarian Connectivity Charter, we are furthering international missions to advance digital inclusion and provide humanitarian support through our digital products and services.
Beyond Short-Term Profits
Increased 4G population coverage;
Networks cover 1.3 billion people across our footprint countries
Increased 4G population coverage; >44% base stations located in rural areas
Creating Digital Champions:
- Axiata Digital Innovation Fund (ADIF)
- RM43 million in 14 Malaysian companies
- 60% Bumiputera technopreneur start-ups
- Launched USD15 million Dialog Axiata Digital Innovation Fund (DADIF) & USD5 million Smart Axiata Digital Innovation Fund (SADIF)
e-wallet ‘Boost’
- ~2.2 million users
- >11,000 payment touchpoints
Nurturing People
43 nationalities
Organisational transformation to Modern, Agile & Digital (M.A.D.)
Building digital talent factory
- RM169 million invested in Talent Development since 2009
- 145 top talents identified across the Group for leadership development
- 60% top management identified internally
- 12% women in senior leadership positions
- 3 months maternity leave
Process Excellence and Governance
- Enhanced Group governance to align with digital ambition
- Digitising and modernising core functions
- Social Reputation Score to track real time brand sentiments
- Enhanced Supplier Code of Conduct
Promoting a safe workplace for all:
- Conducted 3,688 safety inspections
- 185 consecutive accident free days
Axiata Partner Development Programme targets by 2020:
- 4 National Champions
- 2 Regional Champions
- 1 Global Champion
Planet and Society
- Installed 200 solar sites & 10 wind turbine sites
- ~25% carbon emission reduction per renewable energy site
- “Tower to Power” project supplies electricity to rural communities near green telco tower sites in Bangladesh
- >8 million early warning SMS sent
- Customers received >16.6 million free SMS post-disaster
- RM100,000 support towards Mercy Malaysia humanitarian missions
National Contribution
As one of the leading telecommunications groups in Asia with a presence in 11 countries and a customer base of approximately 350 million, Axiata makes a substantial contribution to the countries in which the Group operates. Through its investments in its portfolio of regional OpCos, Axiata is recognised as one of the largest Foreign Direct Investors, best employer, significant taxpayer and substantial purchaser of local services.
Axiata’s triple core business of Digital Telco, Digital Businesses and Infrastructure have created significant economic value and job opportunities, both directly and indirectly, to almost 1.0 million people in 11 countries across ASEAN and South Asia.
As a committed long-term investor and exemplary corporate citizen in all its countries of operation, Axiata has supported and created socioeconomic value in areas identified as national priorities and agendas in the countries within its footprint, including furthering the United Nations Sustainable Development Goals (UNSDG).
To continue to make a real economic difference in the countries and communities served, Axiata has been measuring its investment impact in its National Contribution Report annually over the past four years. Below are the key findings of the report for 2017.
USD15.9 billion
in GDP Contribution
for 2017
Supported
more than
1.0 million
Jobs Across Asia
for 2017
spent
USD7.6 billion
on operating expenditure in 2017
Approximately
350 million
customers
Capital Investment
in 2017
USD2.8 billion
Employed
approximately
27,000 employees
across Asia
Multiplier Effect of every
USD1
spent on
Capex

GDP contribution
Malaysia
USD5.7
Indonesia
USD8.0
Sri Lanka
USD5.3
Bangladesh
USD5.6
Cambodia
USD4.6
Nepal
USD7.2